Components
Dashboard Components
Dashboard Overview
This is the main launching pad to create a new or load a saved MatrixEase project.
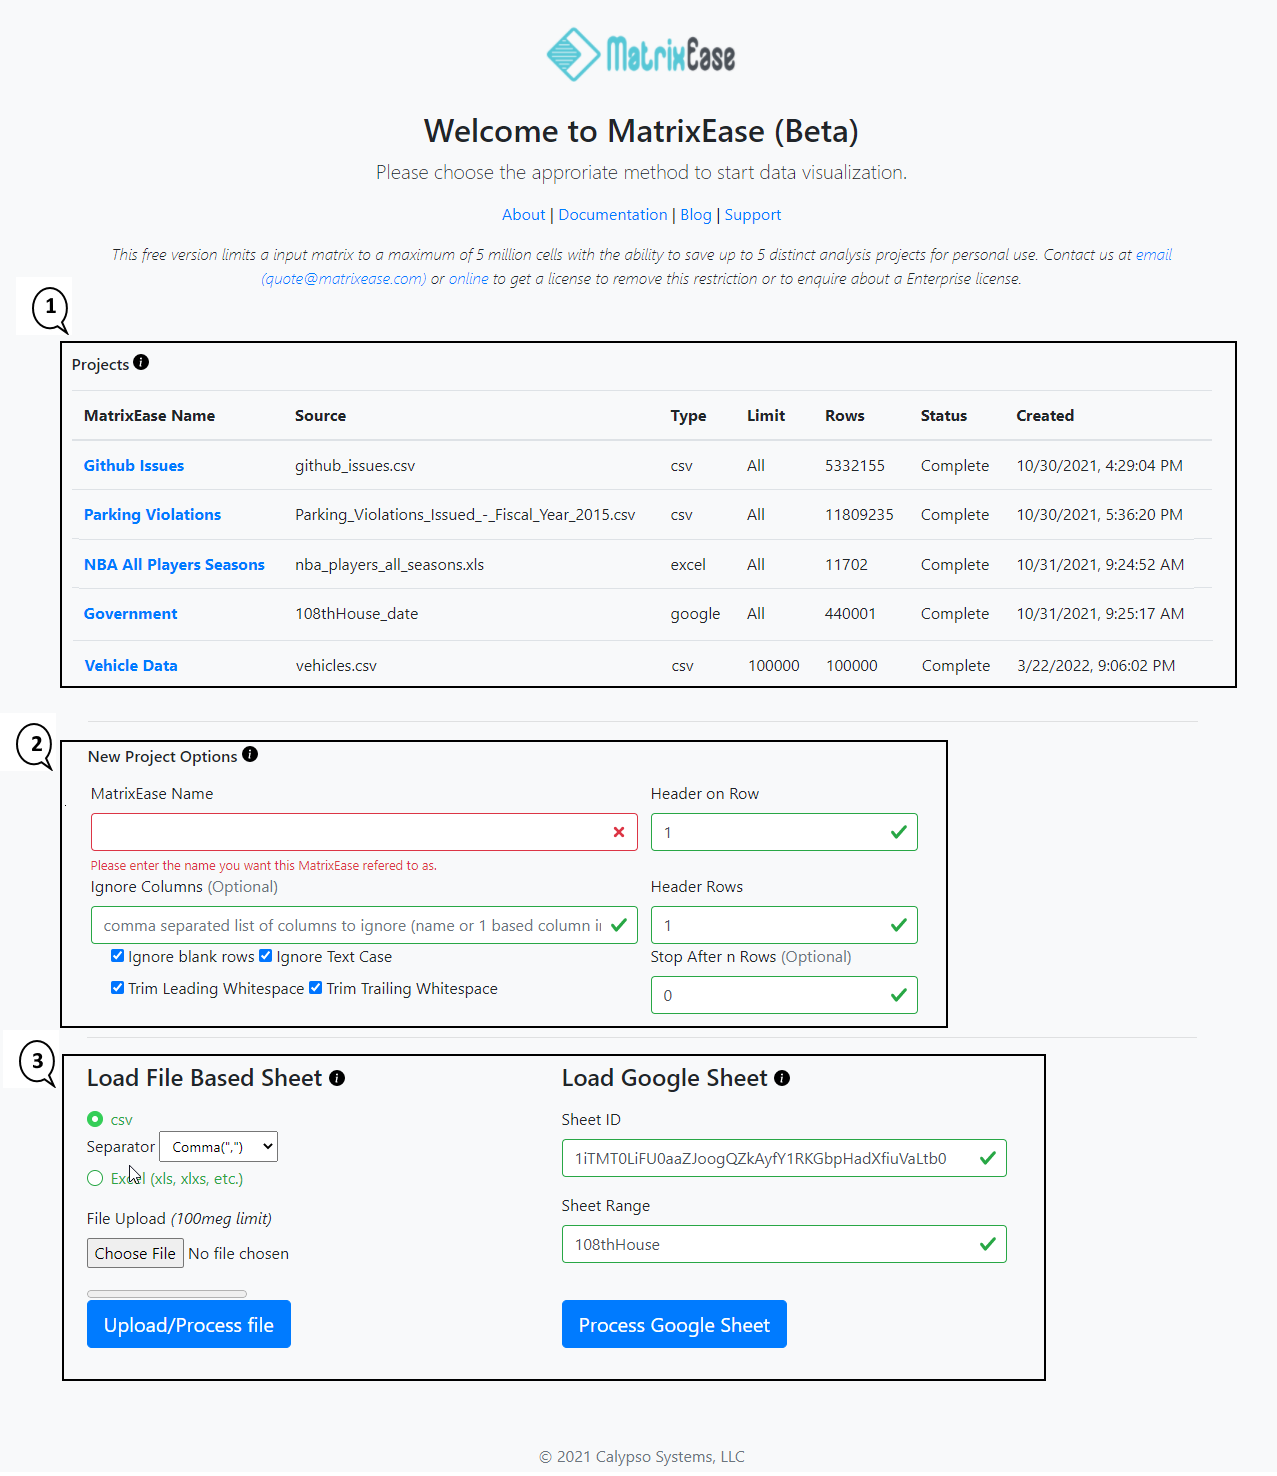
Saved Projects
The shows the list of saved project that you have created.
Saved Projects List
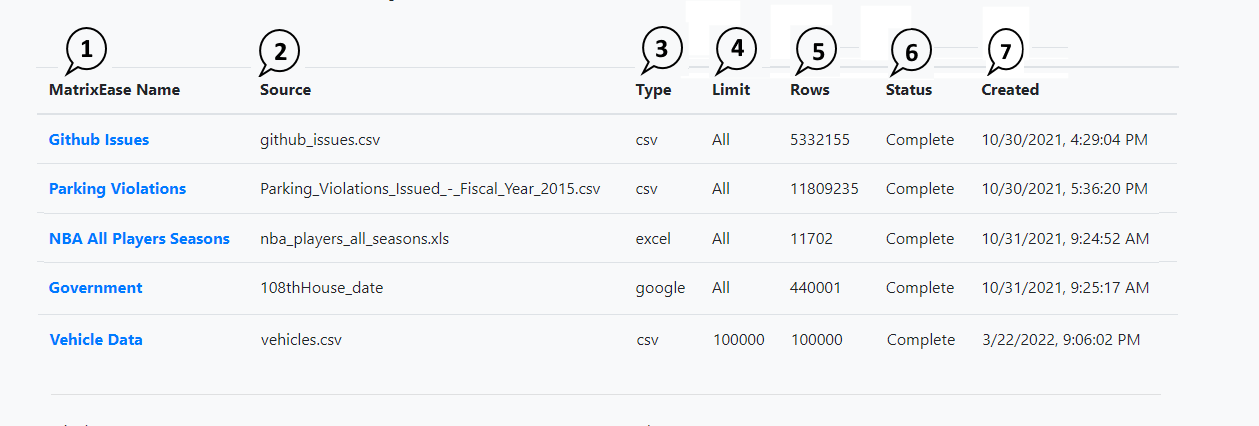
- MatrixEase Name - the name of the saved project
- Source - the file name or Google sheet name of the source matrix
- Type - the type of the source amtrix data (csv, Excel, Google, etc.)
- Limit - the number of rows considered from the source matrix (All or a number)
- Rows - the actual number of rows in the matrix
- Status - the current status of the project (Complete and Running if still being processed)
- Created - the date and time that the project was created
Project Options
The Project Options section allows you customize how the matrix data is loaded into a new project.
New project options settings
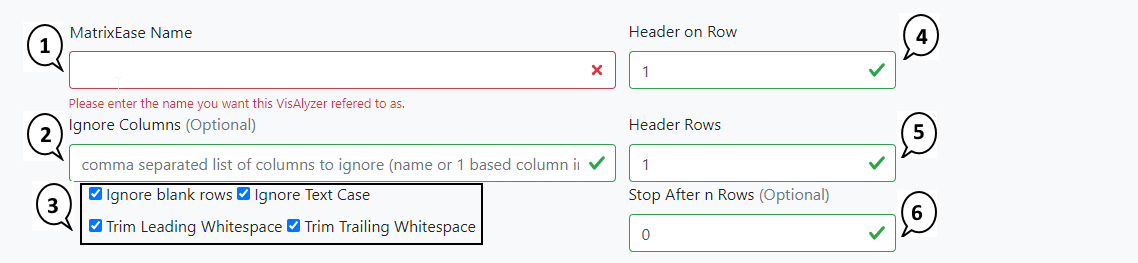
- MatrixEase Name - the name to be saved for the new project
-
Ignore Columns - is list of columns (in CSV format) to not include from the source matrix
- Column Indexes - the 1 based index list of columns to ignore. ex: 2, 5, 6 would ignore columns A, E and F in a tradiional spreadsheet
- Column Names - the "named" columns to ignore. These are derived from the names in your spreadsheet or if auto-generated COL_1, COL_2...COL_N
-
Data Rules
- Ignore blank rows - if a row of matrix data has no values, ignore the entire row
- Ignore Text Case - treat all textual data as lowercase for grouping and analysis. (details of actual case will be preserved)
- Trim Leading Whitespace - for textual data remove all leading white space characters
- Trim Trailing Whitespace - for textual data remove all trailing white space characters
- Header on Row - the one based index of the first row to consider as a header in the matrix data (must be 1 or greater)
- Header Rows - the number of rows from the "Header on Row" to consider when forming column names. If zero a column name will be generated (COL_1, COL_2...COL_N
- Stop After n Rows - the number of data rows to process in the matrix. A zero indicates all data is to be consumed.
Load Source
The Load Source section allows you specify the input for the matrix data.
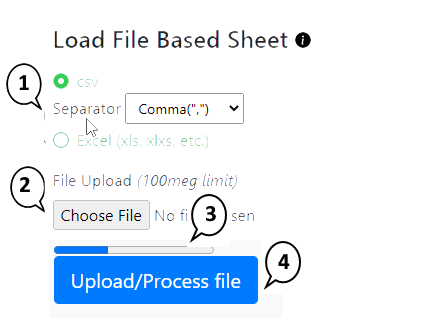
Load Source - File Based
-
File Type
-
csv - a comma separated values text file
- Separator - choose the "c" in the csv type
- Options - Comma(","), Tab("\t"), Space(" "), Pipe("|"), Colon(":"), Semicolon(";")
-
csv - a comma separated values text file
-
Excel (xls, xlxs, etc.) - a Microsoft Excel file
- xlsx & xlsb - OpenXml - 2007 and newer
- xls - BIFF - 97-98, 2000-2004, XP, 2.0 to 5.0, 95
- Choose File - press this button to choose a local file to upload for processing
- Status Bar - shows file upload progress
- Upload/Process File - press this button to create a new MatrixEase project from the uploaded file
Load Source - Google Sheet Based
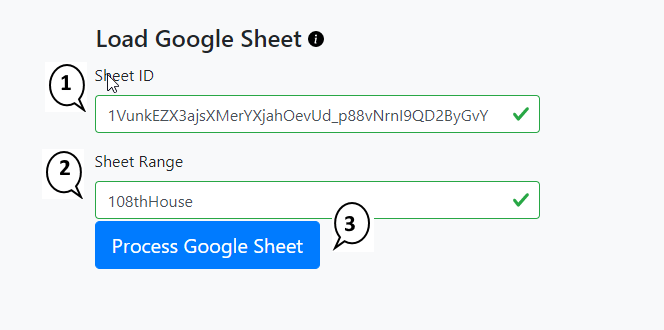
- Sheet ID - The ID of the Google Sheet to load (see below on how to determine this value)
- Sheet Range - the name of the Sheet and range of cells to to load (see below on how to determine this the sheet name)
- Process Google Sheet - press this button to create a new MatrixEase project from the Google Sheet
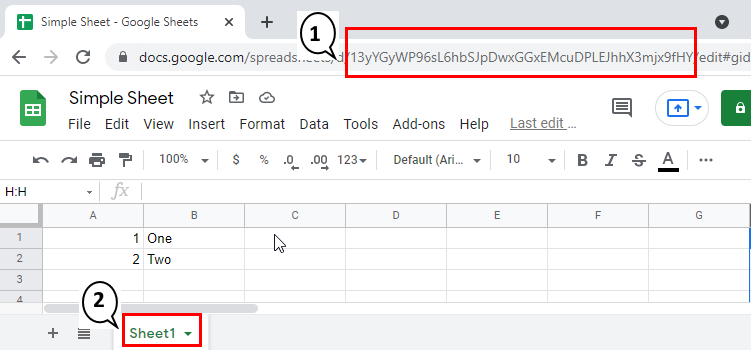
- Sheet ID - this is the Google Sheet ID
- Sheet Name - this is the Goole Sheet Name
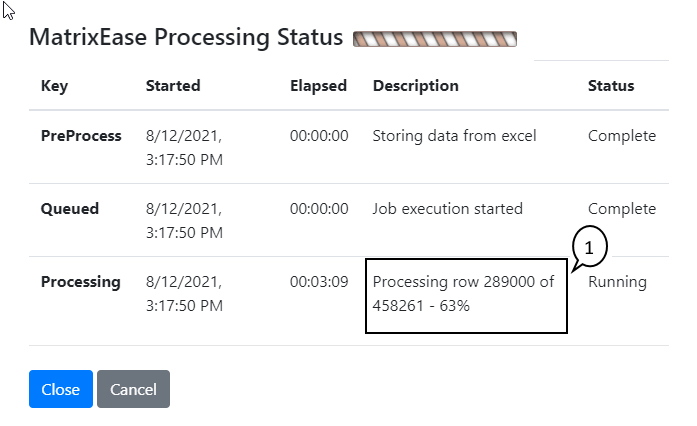
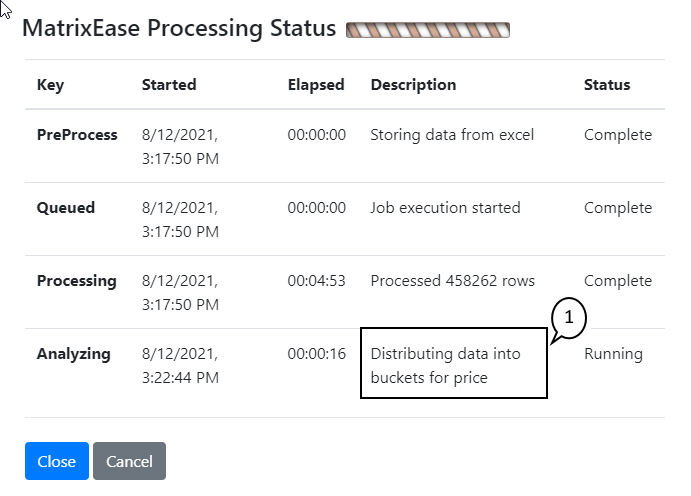
Load Progress
Shows the status of loading and analyzing your matrix data.
Progress stages
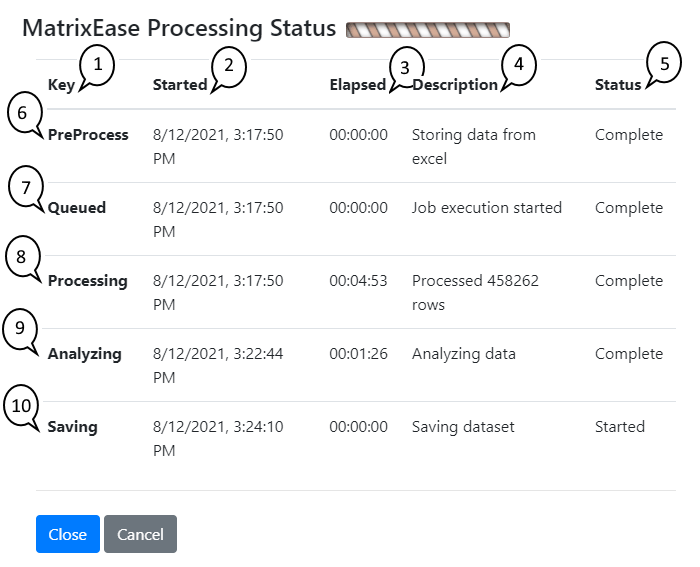
- Key - the named stage in the load process
- Started - the date and time the load process started
- Elapsed - the current updated elapsed time for this stage
- Description - what is currently happening during this stage
- Status - the status of this stage in processing - Started, Running, Complete, Failed
- PreProcess - this stage is uploading or retreiving the matrix data from the source system
- Queued - this stage shows that the item is currently queued and pending execution
- Processing - this stage shows the raw read of the matrix data
- Analysis - this stage shows the status of the analysis of the data
- Saving - this stage shows the progress on saving a optimized MatrixEase project
MatrixEase Components
Overview
Show a overall picture of the MatrixEase interface and the functionality of each component
Main MatrixEase Interface
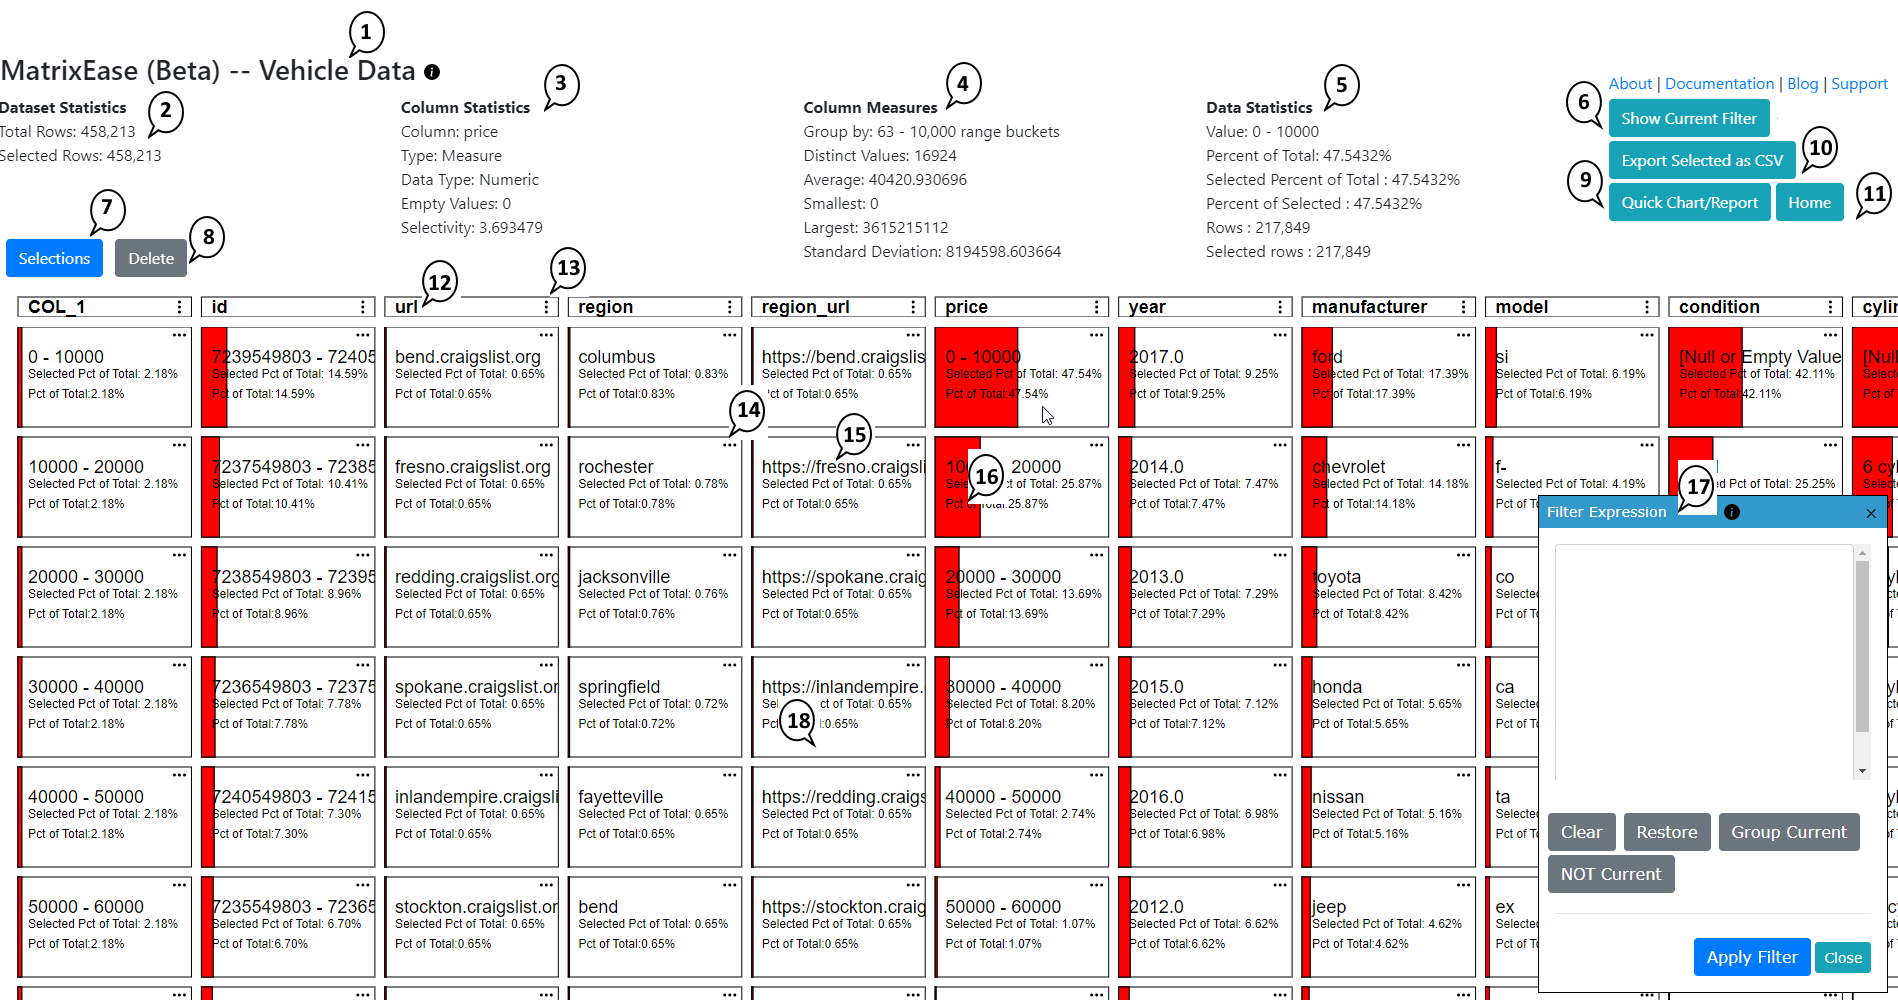
- Title - The name of this saved MatrixEase
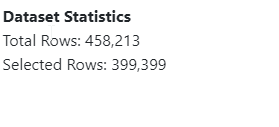
- Dataset Statistics - statsitics for the entire matrix
- Column Statistics - statistics for the current column
- Column Measures - measures for the current column
- Data Statistics - statistics for the current cell
- Show Current Filter - show/hide the Filter Expression Dialog Box(see 17)
- Selections - display sidebar for MatrixEase display options
- Delete - remove this entire saved MatrixEase project
- Quick Chart/Report - create a chart or report based on discovered dimensions and measures
- Export Selected as CSV - create a CSV export file of the currently selectect data
- Home - return to the dashboard (home screen)
- Column Name - the name of the column in the matrix
- Column Action - a menu of actions on a column basis
- Cell Action - a menu of actions on a cell basis
- Cell Data - the name of the cell category and selection measures
- Cell Visualized - color coded to visually show significance of current selection
- Filter Expression - the currently applied filter to the matrix
- Click Filter - click in any cell to change the filter criteria, action based on Selections(see 7)
Cell Visualization
Shows how each column cell is group and classified to represent it's relationship to other column cells.
Saved Projects List
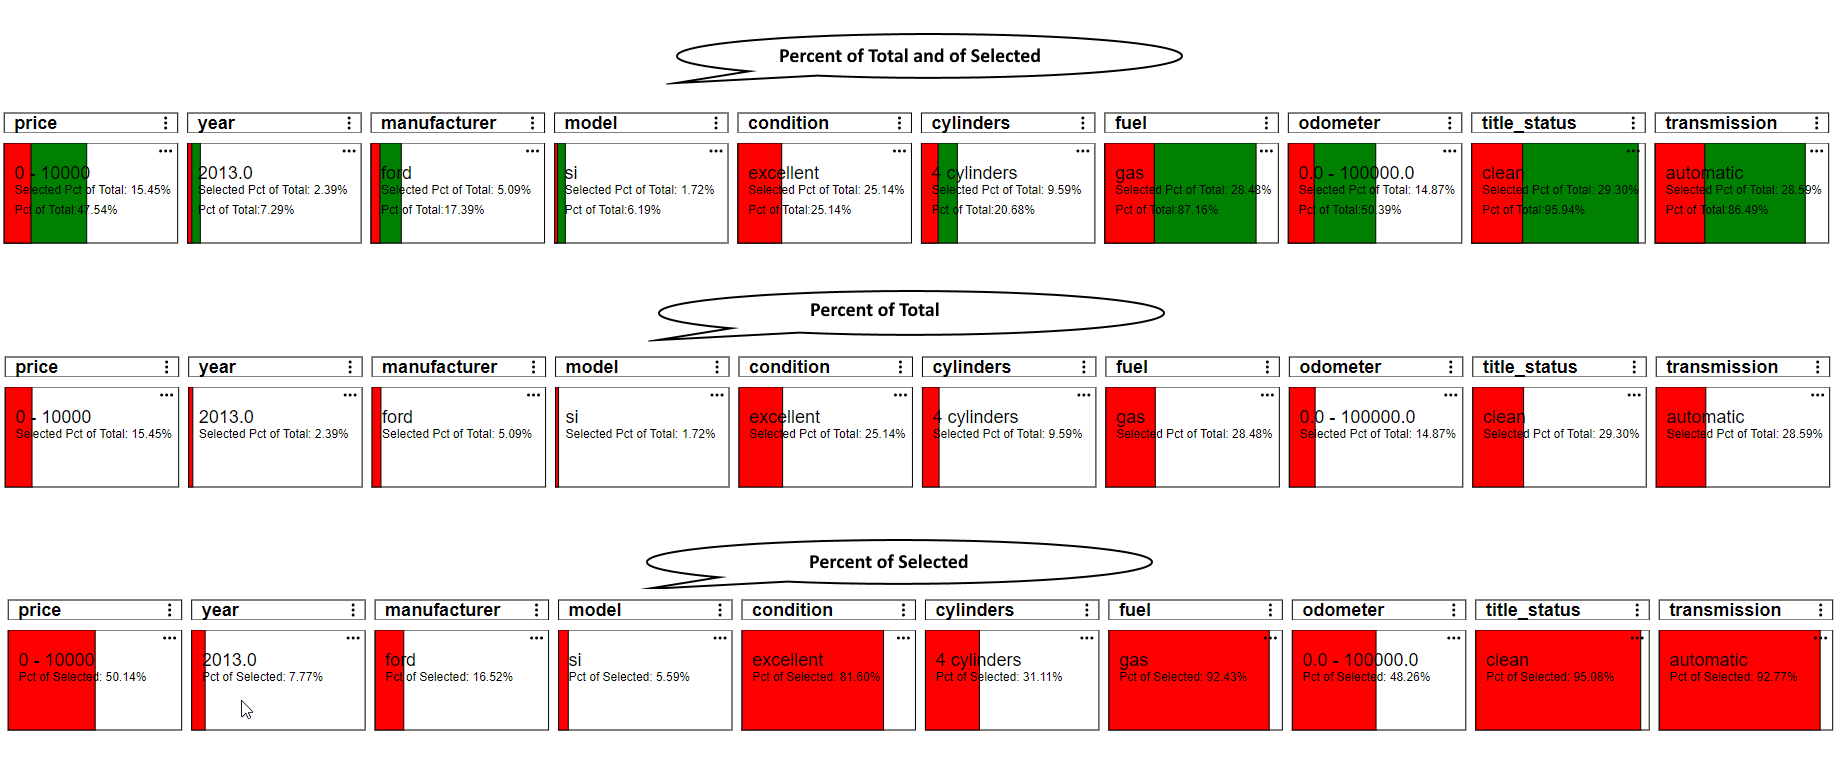
The above image show the same three rows of data with the same filter applied, but with a different visualization percentage scheme applied. The fill on each cell conveys the percentage of total on the whole.
- Percent of Total and of Selected - This show the total percent of the rows for this cell (group) in green and currently selected percent of the rows in red.
- Percent of Total - This shows the percent of the total rows for this filtered cell (group) in red.
- Percent of Selected - This shows the percentage of the total filtered rows for this filtered cell (group) in red.
- The "ford" model accounts for 17.39% of all the rows with "ford" in this column compared to the total number of rows.
- The "ford" model accounts for 5.09% of the filter rows with "ford" in this column compared to the total number of rows.
- The "ford" model accounts for 16.52% of the filter rows with "ford" in this column compared to the total number of filtered rows.
Filtering
Shows how set filters on the data based on boolean logic as you interact with cells visually.
Saved Projects List

The above image show the various ways to filter and options.
-
Left Click Cell Selection - the selections sidebar allow you to choose the left click action on cells
- Overwrite Selection - replaces the current filter with a filter for only the selected cell
- OR Selections - adds to the current filter with a filter with selected cell as a OR condition
- AND Selections - adds to the current filter with a filter with selected cell as a AND condition
-
Right Click Cell Selection - right click in any cell to choose to add the selection as different types
- ONLY this Cell - replaces the current filter with a filter for only the selected cell
- OR this Cell - adds to the current filter with a filter with selected cell as a OR condition
- AND this Cell - adds to the current filter with a filter with selected cell as a AND condition
- Pending Filter Change - this will be flashing if the filter in the Filter Expression dialog is changed from what is displayed as the selection (i.e. it has not been applied)
-
Filter Expression
- Expression Block - show the current filter, you can edit this manually to add complex filters (and, or, not groups, etc.)
- Clear - clears the current filter expression
- Restore - remove the current pending filter (see flashing notification) and restor the active expression
- Group Current - treat the current expression a group (add parenthesis) new operations will be addative after the group
- NOT Current - reverse the logic in the current expression to exclude items in the filter expression
- Close - hide the Filter Expression dialog
- Apply Filter - Apply the current viewed filter to the MatrixEase project
Quick Statistics
A quick view of matrix statistics on the whole, column and cell level. Will auto-update as you hover over columns and cells.
Column Statistics

Will update as you hover over different columns
- Column - the name of the active column
- Type - is this column a Measure or Dimension
- Data Type - does this column contain a Numbers, Date/Times or Text
- Empty Values - the number of empty values in this column
- Selectivity - the overall uniqueness of data in this column (0 to 100 - the higher the number the moer unique values)
Data Statistics
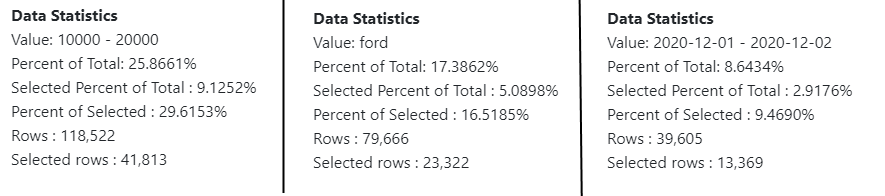
Will update as you hover over different cells
- Value - the named valued of the cell (the grouped catgeory name or range if numberic or date/time)
- Percent of Total - the percent of the total rows for the rows in the cell
- Selected Percent of Total - the percent of the total rows for the filtered rows in the cell
- Percent of Selected - the percent of the filtered rows for the filtered rows in the cell
- Rows - the total number of rows represented by this cell
- Selected Rows - the number of rows represented by this cell with the current filter applied
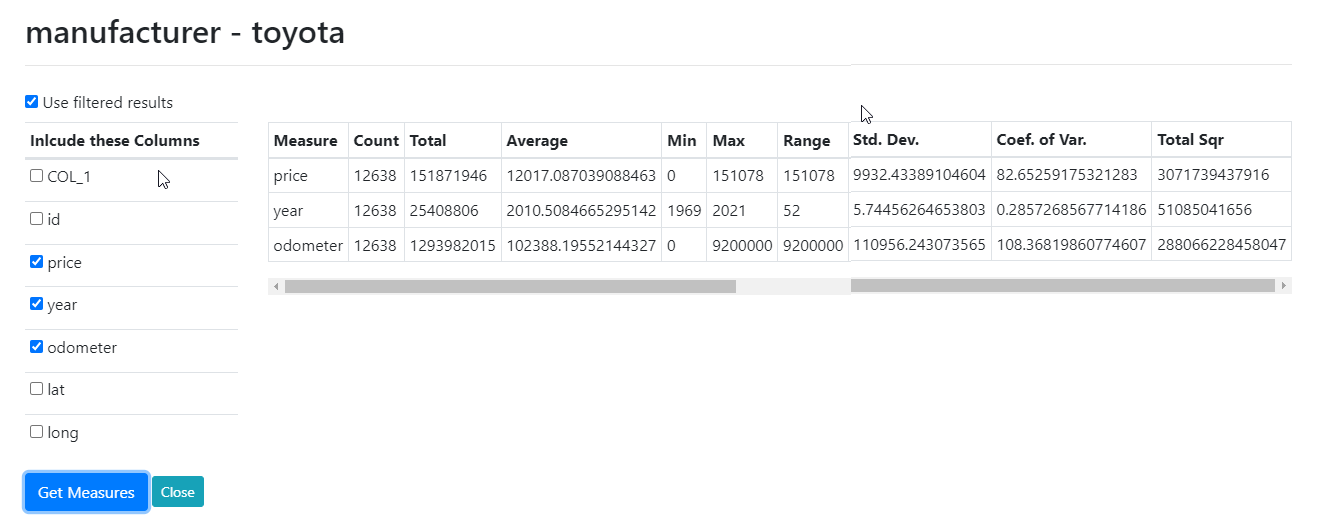
Column Measures
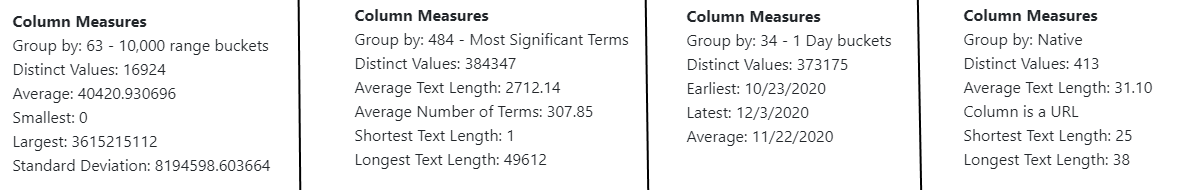
Will update as you hover over different columns
- Group by - will show the number of categories (buckets) and the type of category applied. Native infers raw format was used for grouping.
- Distinct Values - the total number of distinct values in this column
-
For Numbers
- Average - the calculated average of all the numbers in the column
- Smallest - the smallest number of all the numbers in the column
- Largest - the largest number of all the numbers in the column
- Standard Deviation - the calculated standard deviation of all the numbers in the column
-
For Text
- Average Text Length - the calculated average text length of all the data in the column
- Average Number of Terms - the calculated average number of terms (separated by white space) of all the data in the column
- Column is URL - specifies that all the data in the column is a URL
- Short Test Length - the shortest text length of all the data in the column
- Longest Test Length - the longest text length of all the data in the column
-
For Date/Time
- Earliest - the earliest date/time of all the data in the column
- Latest - the latest date/time of all the data in the column
- Average - the average date/time of all the data in the column
Selections
Apply different filters and actions to the MatrixEase project
Selection slide-out
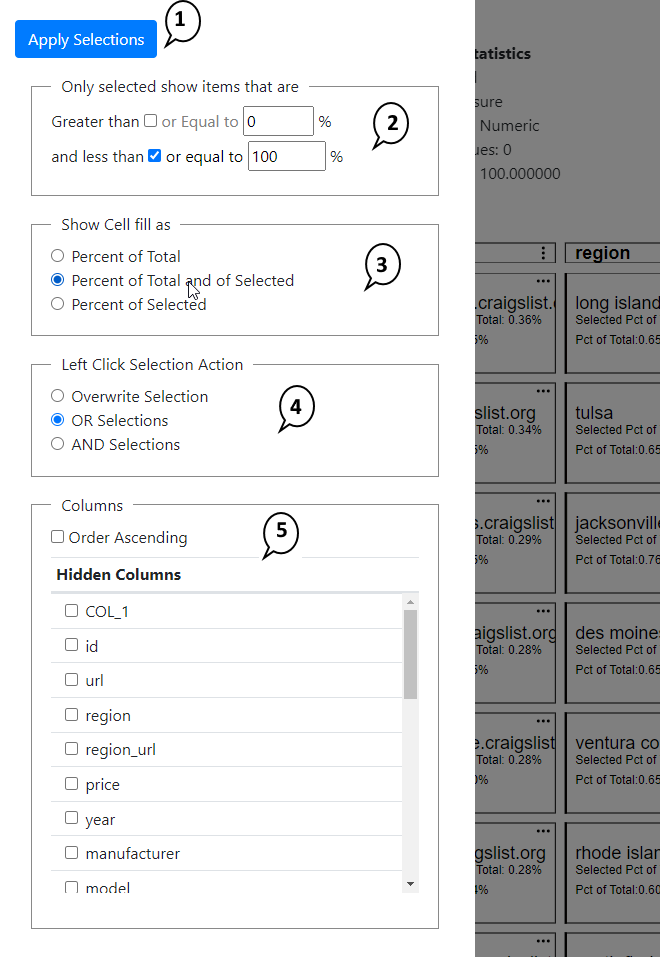
- Apply Selections - apply the currently configured items in the slide-out to the MatrixEase project
- Only show items that are - this allows you to show only the cells that are within the defined range of the percentage of total
-
Show Cell fill as
- Percent of Total - color the cell in red as a percentage of the total
- Percent of Total and of Selected - color the cell in green as a percentage of the total and color the cell in red as the percentage of the selected filter
- Percent of Selected - color the cell in red as the percentage of the selected filter
-
Left Click Selection Action - if you left click in a cell apply the filter as
- Overwite Selection - replace the entire filter with a filter of this cell
- OR Selections - add to the current filter a OR of this cell
- AND Selections - add to the current filter a AND of this cell
-
Columns
- Order Ascending - order the columns by percentage in ascending order (smallest to largest)
- Hidden Column - hide the marked column from the display
Column Actions
Use column actions by right clicking on a column header.
Column Setttings
Use column settings to see general metrics on the column and manually change the categorization mechanism.
Text Settings
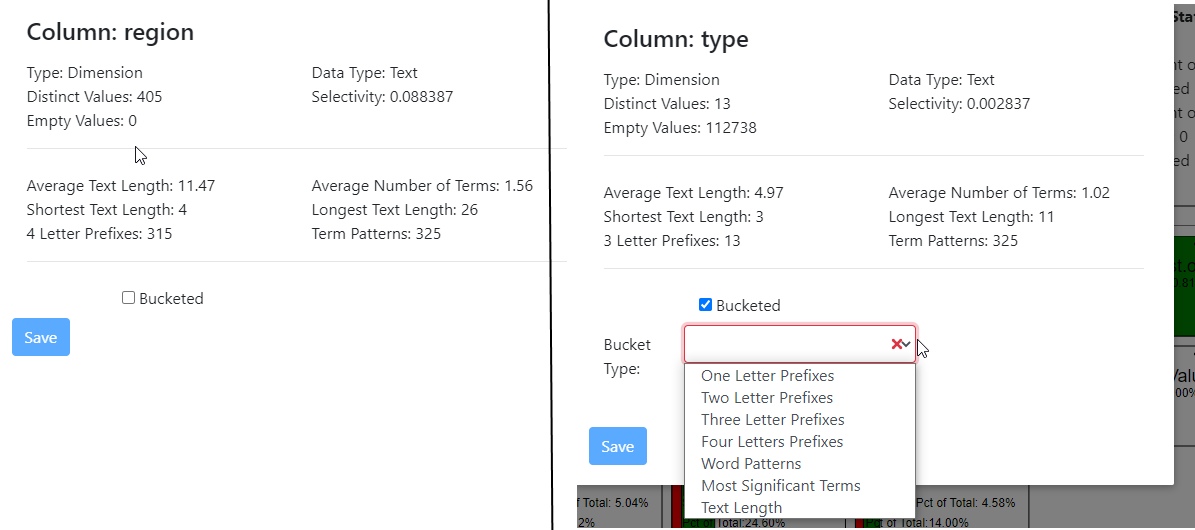
- Top secton shows metrics on the column (see Column Statistics and Measures above)
- For text the 2nd secion will also conatin counts of different catgeorizations mechanisms
-
Bucketed - if check the column has been categorized - you can force or change categorization
- Natural - use the raw data for cell groups
- One Letter Prefixes - use the first character of the text for cell groups
- Two Letter Prefixes - use the first two characters of the text for cell groups
- Three Letter Prefixes - use the first three characters of the text for cell groups
- Four Letters Prefixes - use the first four characters of the text for cell groups
- Word Patterns - determine available word patterns for cell groups
- Most Significant Terms - analyze the terms in all the text using TF-IDF for cell groups
- "Text Length - use the average length of text for cell groups
- "Url Schemes - use the URL Scheme cell groups (http, https, ftp, etc.)
- "Url Domains - use the URL domain for cell groups
- "First Url Path - use the 1st part of the URL (after domain) for cell groups
- Second Url Path - use the 2nd part of the URL (after domain) for cell groups
- Third Url Path - use the 3rd part of the URL (after domain) for cell groups
- "Common Url Path Terms
Number Settings
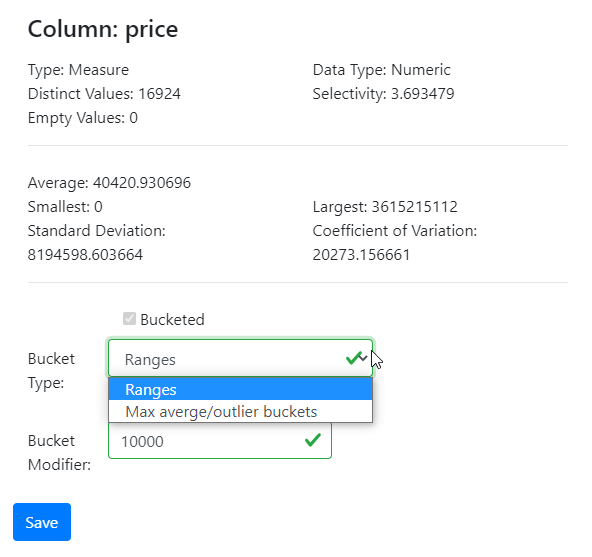
- Top secton shows metrics on the column (see Column Statistics and Measures above)
- For numbers the 2nd secion will also conatin counts of different catgeorizations mechanisms
-
Bucketed - if check the column has been categorized - you can force or change categorization
- Ranges - uses the number entered in the "Bucket Modifier" field as as a range to group numbers from lowest to highest for cell grouping
- Max average/outlier buckets - uses the average and standard diviation of all values and the number entered in the "Bucket Modifier" field as the number of categories to create bucks for cell grouping. Any item that all out of the standard grouping will be put in high and low outlier groups.
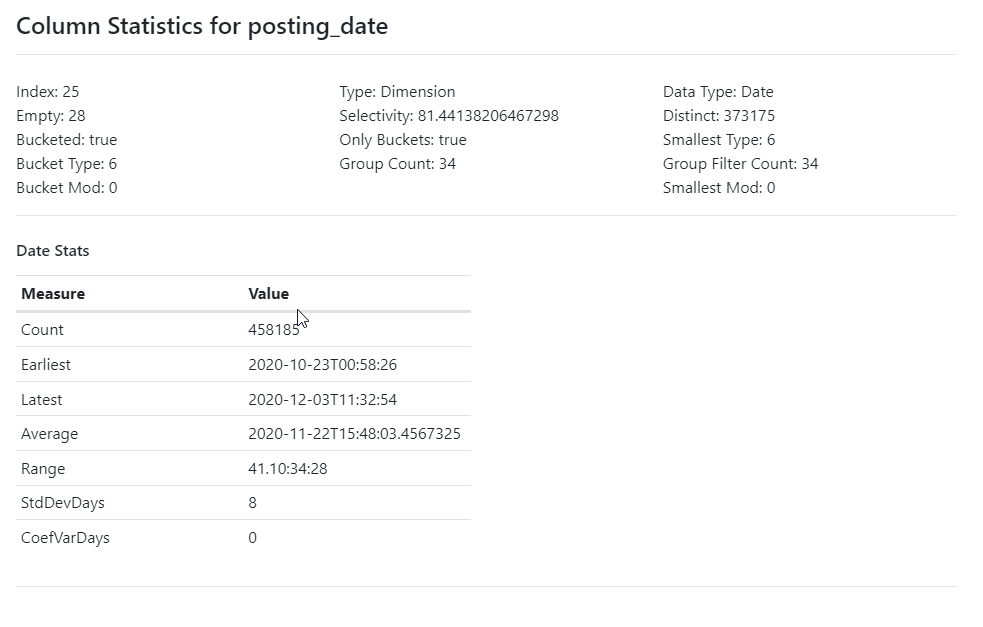
Date/Time Settings
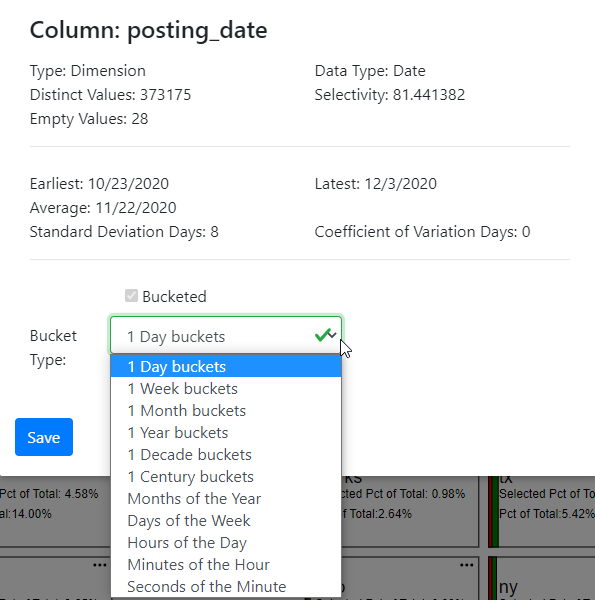
- Top secton shows metrics on the column (see Column Statistics and Measures above)
- For date/time the 2nd secion will also conatin counts of different catgeorizations mechanisms
-
Bucketed - if check the column has been categorized - you can force or change categorization
- Milli-Second buckets - from earliest to latest break the date/time into milli-second cell groups
- 1 Second buckets - from earliest to latest break the date/time into one second cell groups
- 1 Minute buckets - from earliest to latest break the date/time into one minute cell groups
- 1 Hour buckets - from earliest to latest break the date/time into one hour cell groups
- 1 Day buckets - from earliest to latest break the date/time into one day cell groups
- 1 Week buckets - from earliest to latest break the date/time into one week cell groups
- 1 Month buckets - from earliest to latest break the date/time into one month cell groups
- 1 Year buckets - from earliest to latest break the date/time into one year cell groups
- 1 Decade buckets - from earliest to latest break the date/time into one decade cell groups
- 1 Century buckets - from earliest to latest break the date/time into one year cell groups
- Months of the Year - break the date/time inot each month of the year for cell groups
- Days of the Week - break the date/time into each day of the week for cell groups
- Hours of the Day - break the date/time into each hour of the day for cell groups
- Minutes of the Hour - break the date/time into each minute of the hour for cell groups
- Seconds of the Minute - break the date/time into each second of the minute for cell groups
Column Stats
Use column stats to see detailed statistics and metrics on the columns data.
Text Stats 1
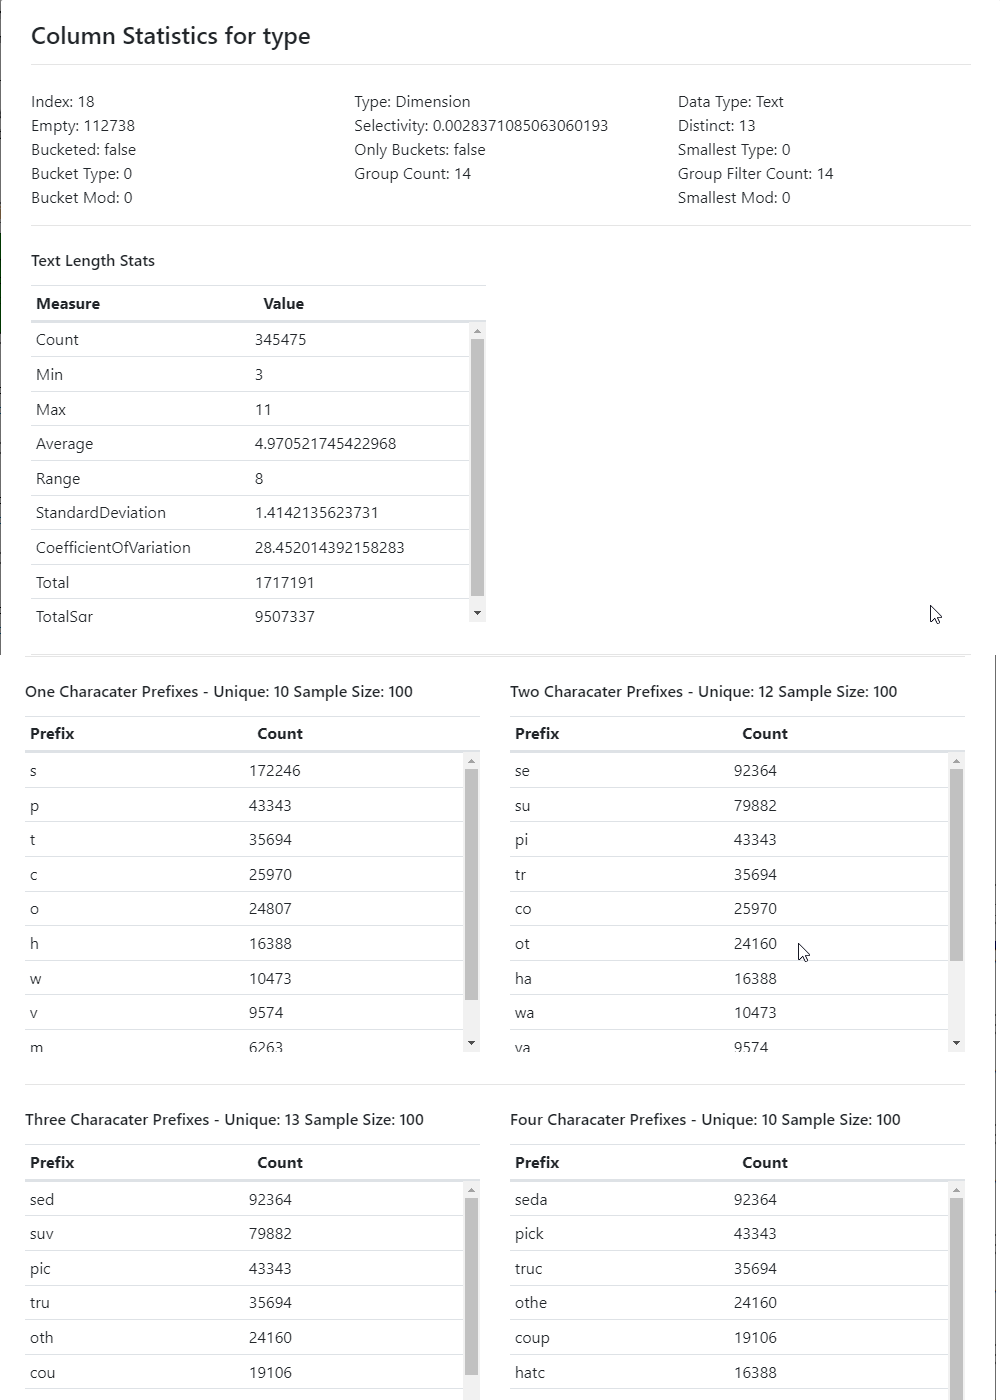
- Header - shows metrics for text columns
- Unique - the total nuber of unique values
- Sample Size - the maximum size of unique values considered
- Text Length - shows statistics for the length of text
- One Character Prefixes - shows the top one character prefixes and counts for each
- Two Character Prefixes - shows the top two character prefixes and counts for each
- Three Character Prefixes - shows the top three character prefixes and counts for each
- Four Character Prefixes - shows the top four character prefixes and counts for each
Text Stats 2

- Unique - the total nuber of unique values
- Sample Size - the maximum size of unique values considered
- All Term Stats - statistics on terms used per cell across all rows
- Distinct Term Stats - statistics on the distinct terms used per cell across all rows
- All Considered Terms Stats - statistics on terms used per cell across all rows removing common(stop) words
- Distinct Considered Terms Stats - statistics on the distinct terms used per cell across all rows removing common(stop) words
- Term Counts - the top terms in the document and the occurance count
- Term Weights - the ranking by TK-IDF (Term Frequency — Inverse Document Frequency) terms in the document
- Calculated Term Patterns - the list of possible term patterns
Number Stats
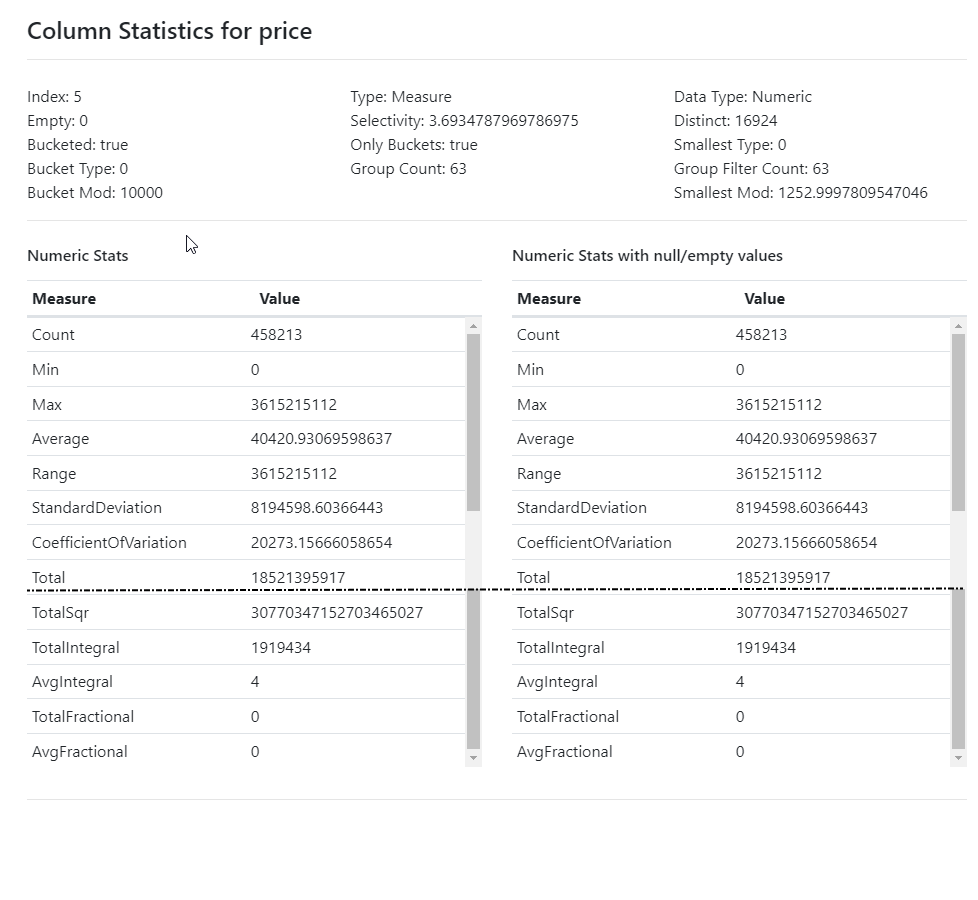
- Header - shows metrics for numeric columns
- Numeric Stats - the numeric metrics on the column across all rows but exluding null or empty values
- Numeric Stats with null/empty values - the numeric metrics on the column across all rows but treating null and empty values as zero
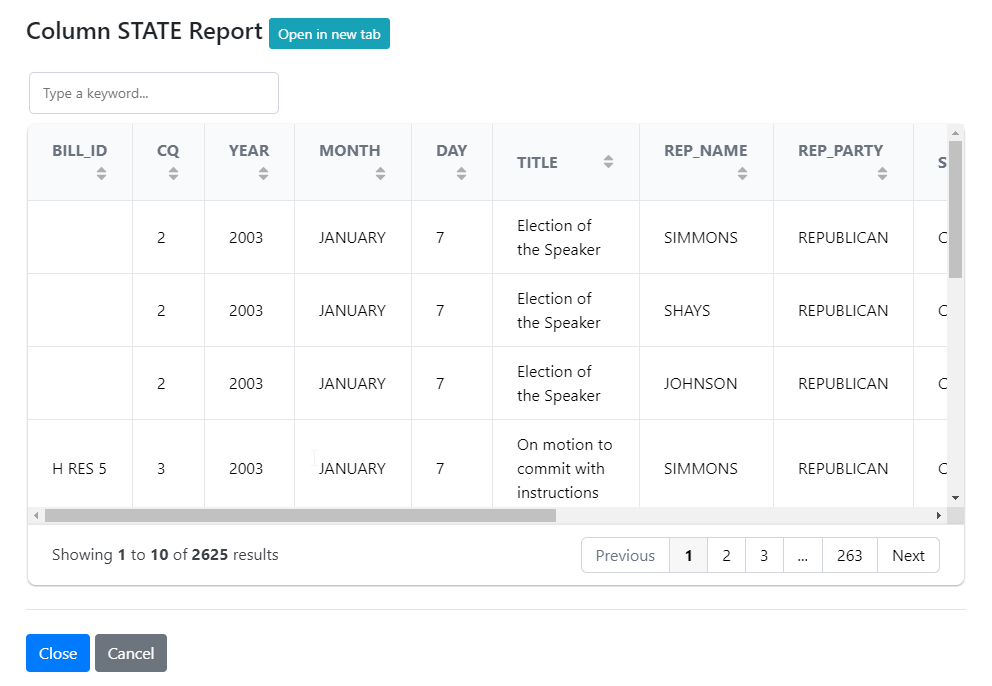
Column Report
Show a matrix report on the data and categorization in this column.
Text Stats 1
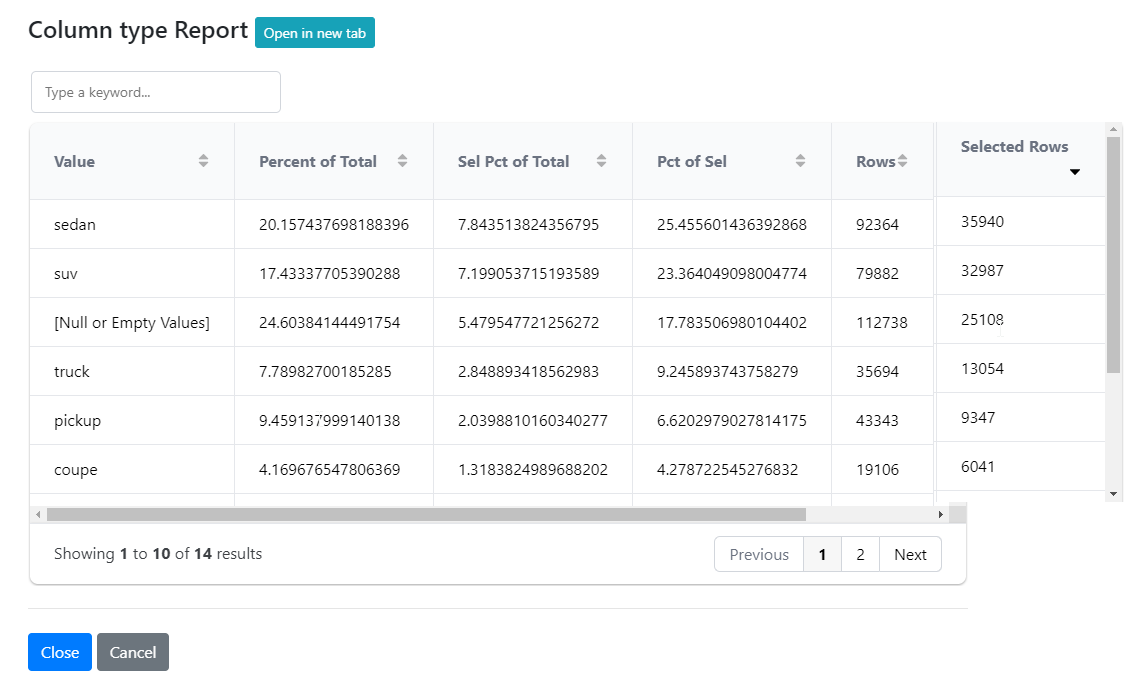
- Value - The raw value or catgeory value for this cell in the column
- Percent of Total - the percentage of rows of this value in the column
- Sel Pct Of Total - the percentage of the filtered rows of this value in the column as it relates to the total rows
- Pct of Sel - the percentage of the filtered rows of this value in the column as it relates to the filtered rows
- Rows - the number of rows where this raw value or catgeory value occurs
- Selected Rows - the number of filtered rows where this raw value or catgeory value occurs
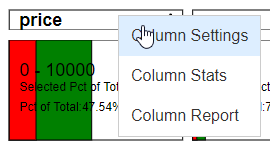
Cell Actions
Use cell actions by right clicking in a cell.
Cell Actions
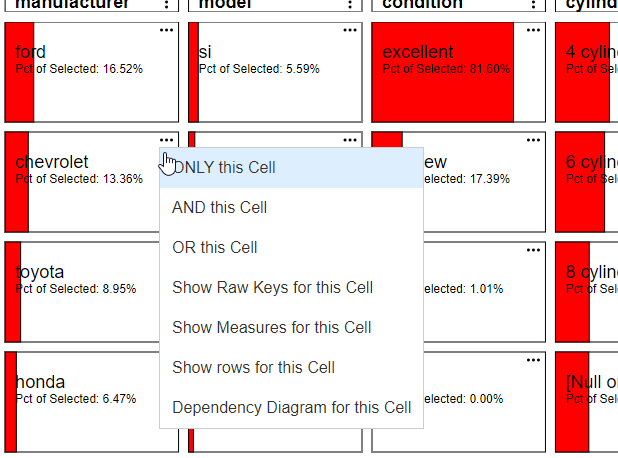
- ONLY this Cell - apply this cell as the new filter for the MatrixEase (replaces all other filter criterial)
- AND this Cell - apply a boolean AND with this cell to the current filter criteria
- OR this Cell - apply a boolean OR with this cell to the current filter criteria
- Show Raw Keys for this Cell - if selected "Ignore Text Case" this will show all raw case sensitive fields for this cell
- Show Measures for this Cell - select and show metrics for measures as they relate to this cell
- Show rows for this cell - show the selected rows for his cell
- Dependency Diagram for this cell - show how this particluar cell relates to other columns cells in terms of overlapping rows
Show Raw Keys for this Cell
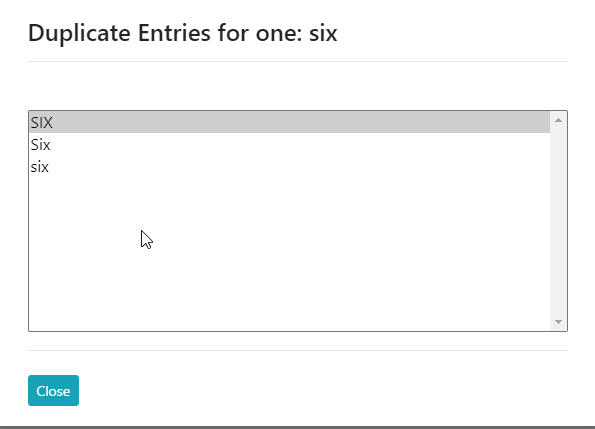
This will display any case sensative duplictaes that were found during discovery if you choose to "Ignore Text Case"
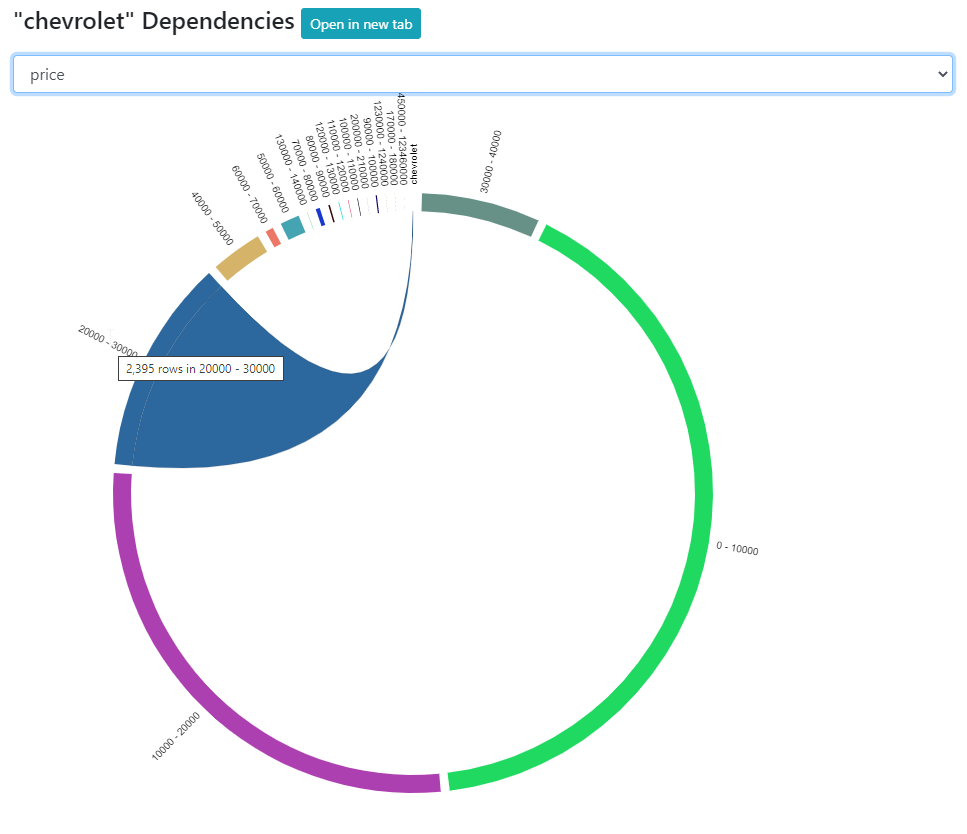
Dependency Diagram for this cell
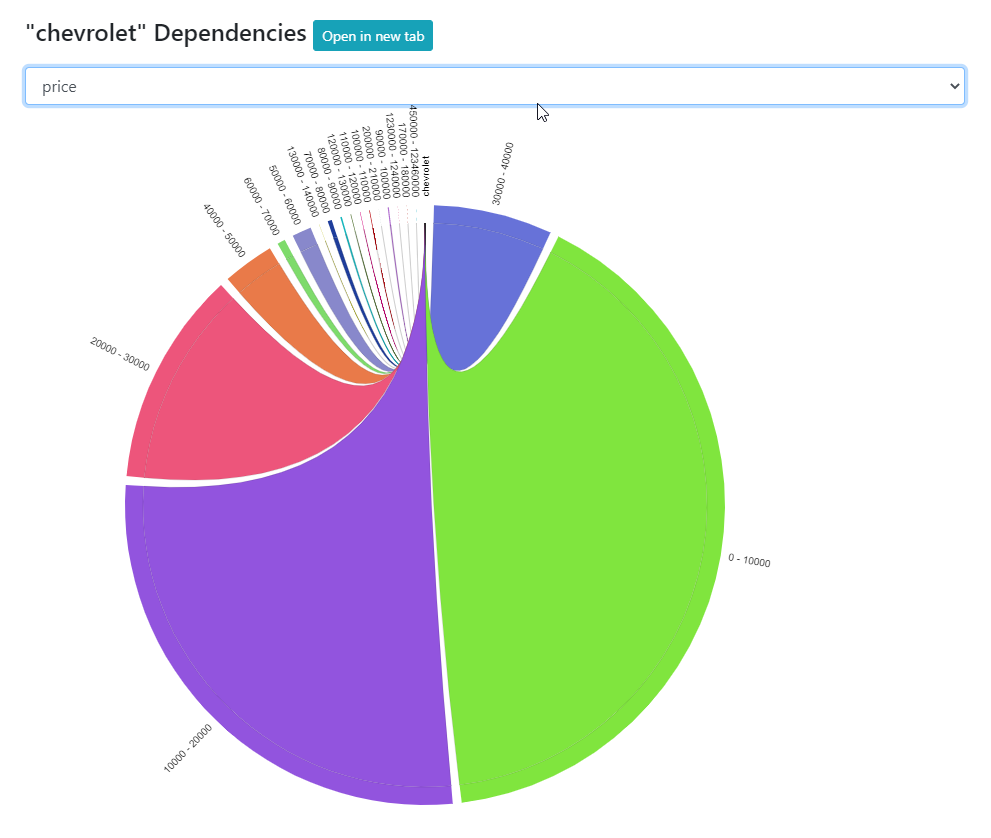
This will display a chord diagram of the rows in this cell and how they relate to a selected columns cells. This allows you to visually inspect significant relationships between cells across columns. Select different columns from the drop-down to chnage the selected view. Hover over individual "chords" to focus in on that relationship
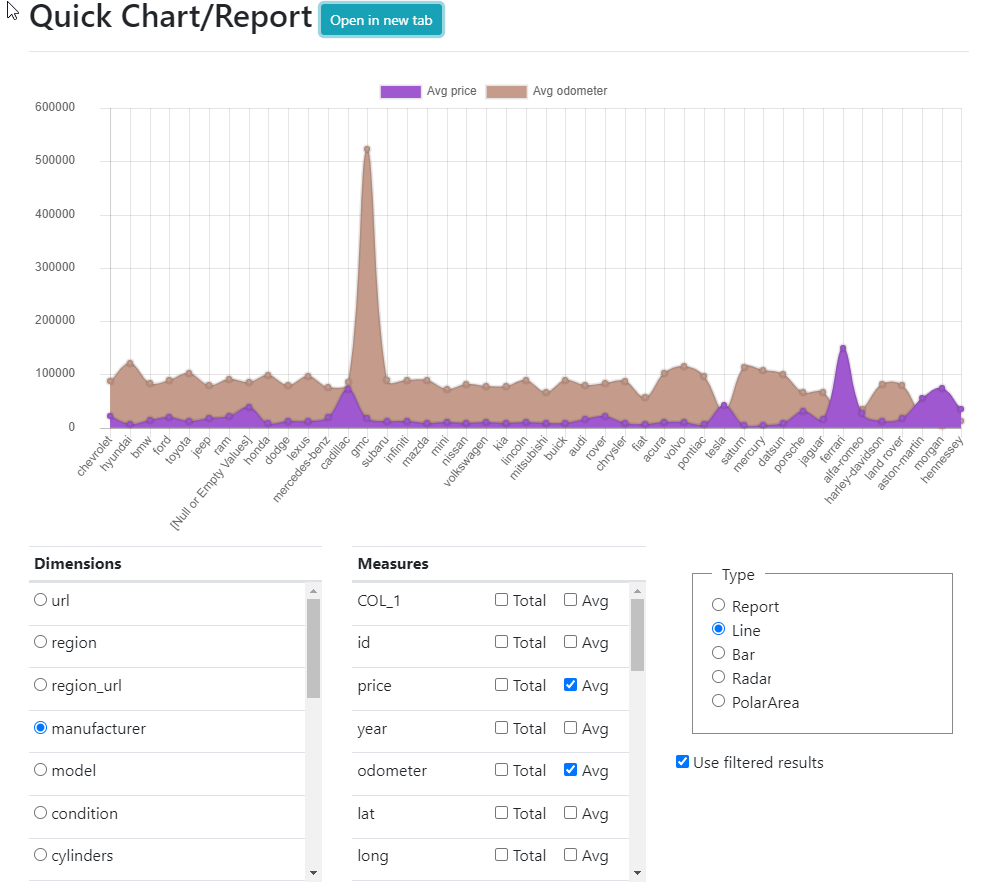
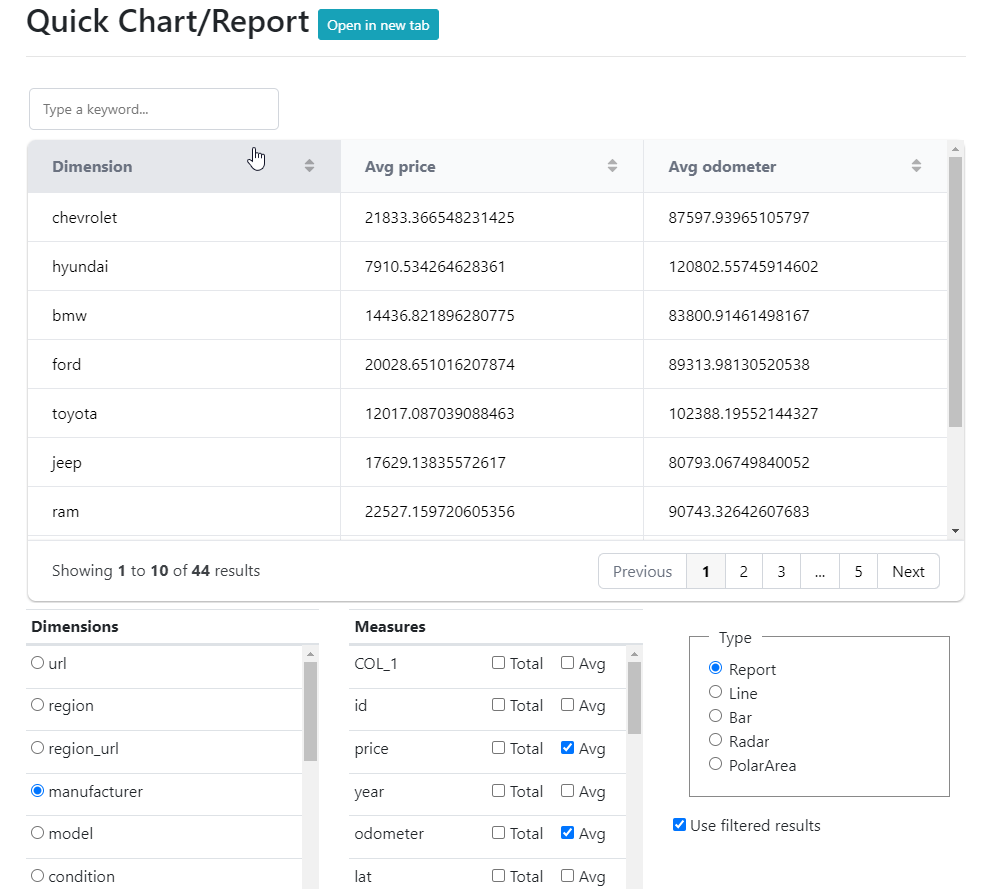
Quick Chart or Report
Create charts and report based off of dimensions vs. metrics (average, total) or count of a dimension.
Quick Chart/Report Setup
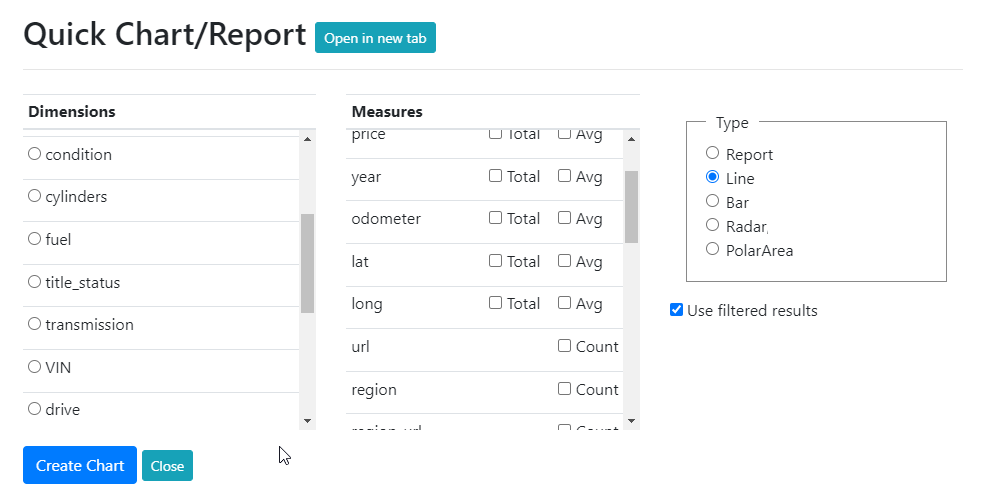
- Open in new tab - Open the rendered chart or report in a new browser tab
- Dimension - pick the dimension you wnat to create a chart or report against
- Measure - pick the measures (total or average) or the count fo dimension to chart/report against the selected dimension
- Type - pick the type of display to render - report or chart (line, bar,
- Use filtered results - use the currently filtered results or the entire set of data